Global trade stood at $31.5 trillion in 2023, decline of about 2% over previous year as per the WTO (World Trade Organization) report. While the figure may look like a cause of concern, most of the decline is due to lower commodity prices with limited volume decline. Here is a look at some of the details.
Global trade has two components – goods or merchandise trade and trade in services. Goods trade stood at $24 trillion during the year as per the report, decline of 5% against 12% growth in 2022. However, actual decline in trade volume was only 1.2% and the rest was due to decline in prices. The decline was led by Russia whose exports fell by 28% and China which declined by 5%. Lower merchandise trade was compensated by growth of 9% in services trade which reached $7.5 trillion. However, service trade also lost some momentum, after growing by 15% in 2022. Even though services trade is less than 25% of total trade, the value generated from services (output minus input cost) is significantly higher and therefore, receives equal attention.
Global trade has been affected by high inflation in energy & food leading to lower disposable income and reduced consumption. Despite coming down by over 40% from their peak in the first two months of 2024, global energy prices are still 30% higher than 2019 level. In Europe, natural gas prices are up 84% over its 2019 level. Similarly, food grain and fertilizer prices are higher by 45% and 44% respectively
Trade in services have increased substantially with the emergence of digitally delivered services (DDS). Total DDS in 2023 stood at $4.2 Tr, close to 14% of global goods and services trade. DDS have grown at over 8% CAGR annually during 2005-2022, against growth of 4.2% for other services and 5.6% for goods trade. However, growth rate for DDS came down to normal level in 2023. Surprisingly, Europe accounts for more than half of global exports of digitally delivered services as per the report.
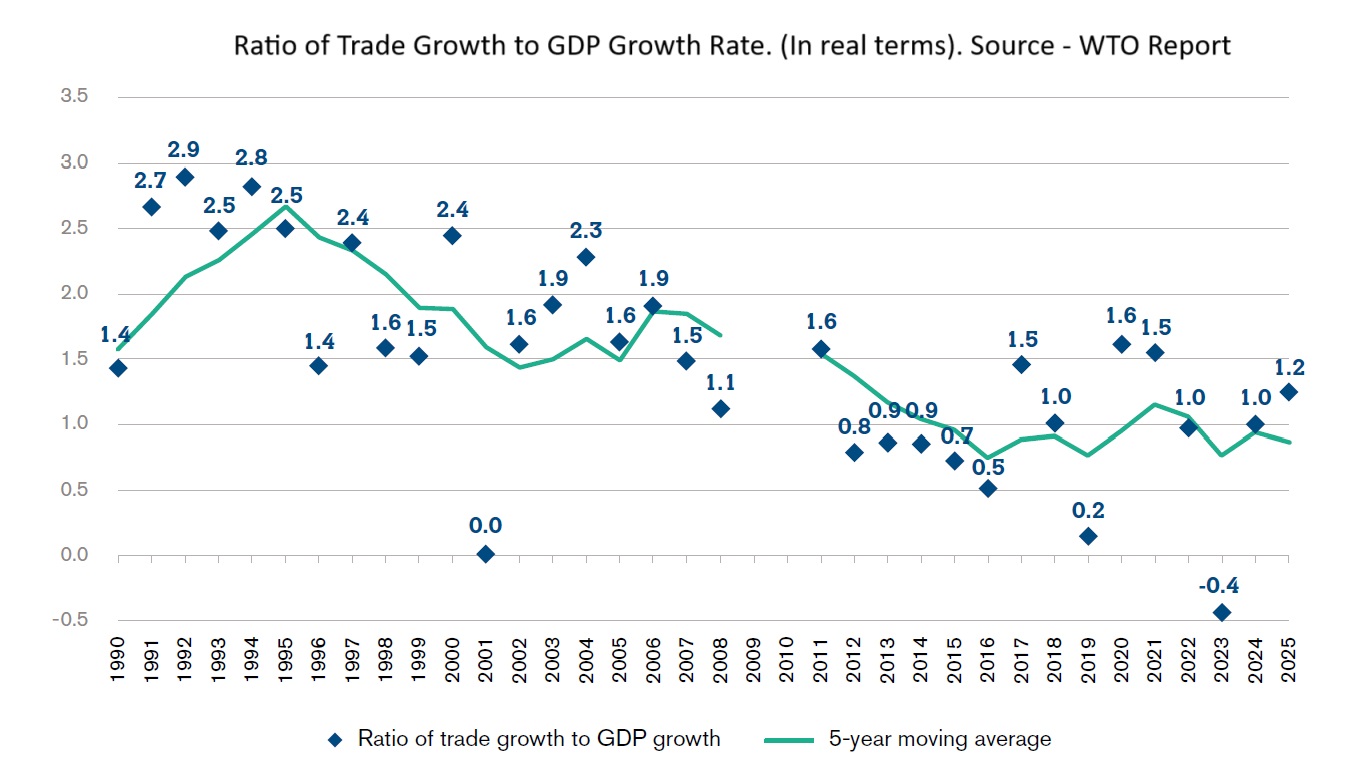
Global trade since 1990s has seen significant transformation. While it grew at nearly twice the rate of growth of GDP in 1990s, growth rate fell to 1.5 times in 2000s, possibly a result of skewed gains from the trade. This has further declined and trade growth is nearly the same as GDP growth after 2010. It would not be surprising if trade growth falls below GDP growth rate in the years to come.
Since 2019, the pre-Covid year, trade to global GDP has increased, from 29% to 33%. This gives a sense of increasing global integration again. However, a closer look shows that most of the increase has come about with higher prices. Since 2019, while trade in terms of value has risen nearly 25%, it is only higher by 6.7% in terms of volume, against about 9% growth in global GDP. This means excluding the price impact, trade upon GDP has actually declined. Increasing trade in value terms does not improve productivity but only leads to transfer of surplus from import dependent nations to the exporting nations.
In terms of regions, Europe contributed the most to trade decline with imports falling by 4.7% and North America by 2%. (All the figure relates to volume growth, not value). Europe also had the highest share of 30% in global trade. While CIS (Commonwealth of Independent States) and Middle-East recorded growth in trade that too, a high rate of 19% and 10%, their share in total is small and therefore, had limited impact on aggregate trade. In terms of exports, North America recorded strong performance with growth of 3.7% reducing its current account deficit significantly.
As a result of decline from China, exports from Asia rose only 0.1%, second consecutive year of below 1% growth. This contrasts with growth of 13% in 2021. US imports from China fell by 22% even as its aggregate imports fell only 6%. Similarly, trade between China and Europe fell by 15%. It appears, a significant degree of decoupling is happening between China and the rest of the world.
Despite the overall growth in services, transport services fell by 8%, a result of decline in shipping rates and lower goods trade. Transport services refer to both passenger and goods transport either through shipping, airline or rail with passenger transport only accounting for 25% of services trade. China’s exports of transport services fell as much as 40%, possibly, another pointer towards decoupling. After years of stress since Covid, travel services, finally, crossed its pre-pandemic level by 4%. For 2023, it recorded growth of 38%. Travel services comprise of accommodation, restaurants, entertainment etc. Transport and travel accounted for about 20% of total services trade each.
In terms of segments, trade in fuel declined the most at 19%, followed by iron & steel at 15%. Both of these are primarily due to decline in prices. Fuel trade is still up 43% over 2019 level. Textiles and clothing fell by about 12%, the segment which sees maximum impact of lower disposable income. This is also the sector which shows lowest increase of just about 3% over its 2019 level. Among the sectors with highest growth is automotive products, growing by 17% during the year
